gdb (GNU Debugger) is a powerful tool for debugging programs in C and other languages. It allows you to inspect the program's state, set breakpoints, step through code, and examine variables.
Start gdb:
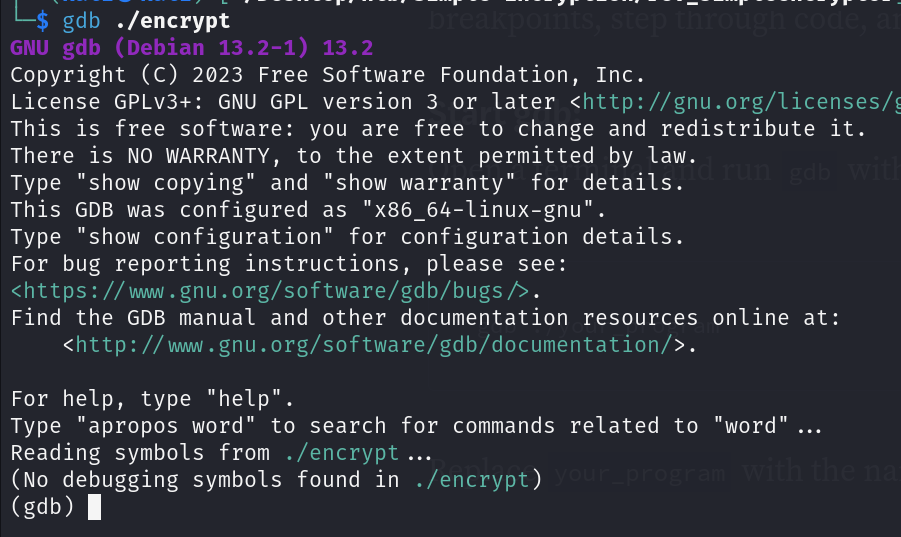
Open a terminal and run gdb with the executable as an argument:
gdb ./your_programReplace your_program with the name of your executable.

Run the Program:
Once inside gdb, you can run your program by typing:
run [program arguments]

It points out exactly where the segmentation fault occurred.
Review Assembly Code:
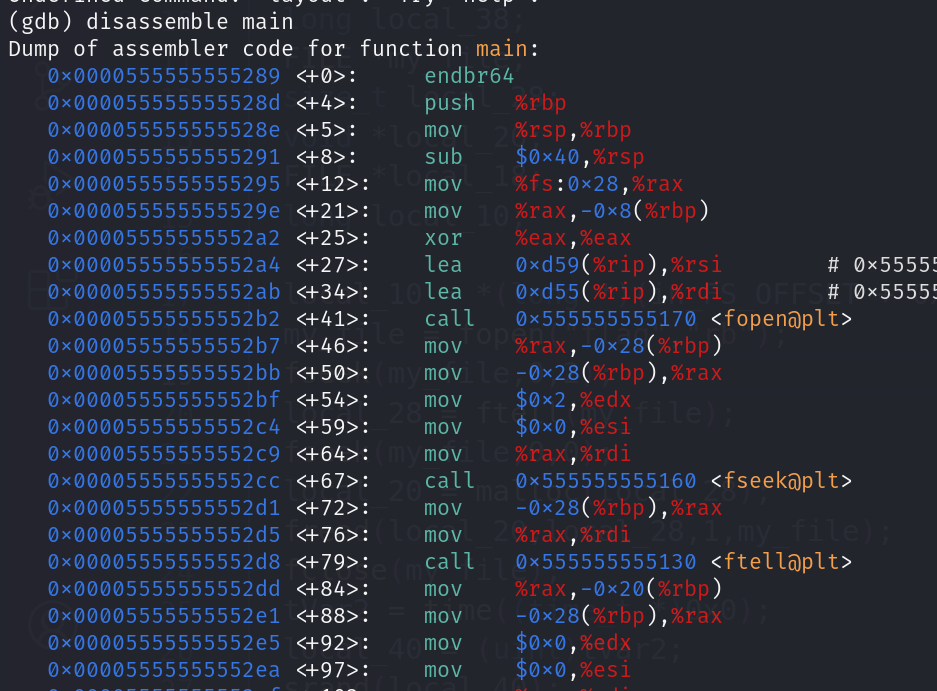
If you want to inspect the assembly code, use disassemble:
disassemble main
Set a Breakpoint:
Use breakpoints to stop the program’s execution at a specific line.
break mainSet a breakpoint at a specific line number:
break <line_number>

Continue Execution:
Continue the program’s execution until the next breakpoint or until it completes:
continueStep through Code:
Use step to execute the next line of code and enter into functions:
stepUse next to execute the next line of code, but it won't enter functions:
nextPrint Variables:
To print the value of a variable, use the print command:
print variable_nameBacktrace (Call Stack):
To see the call stack (backtrace), use:
btInspect Memory:
View the content of memory at a specific address:
x/size_format addressFor example, to print the contents of 4 bytes at the address stored in the rsp register:
x/4x $rspInfo Registers:
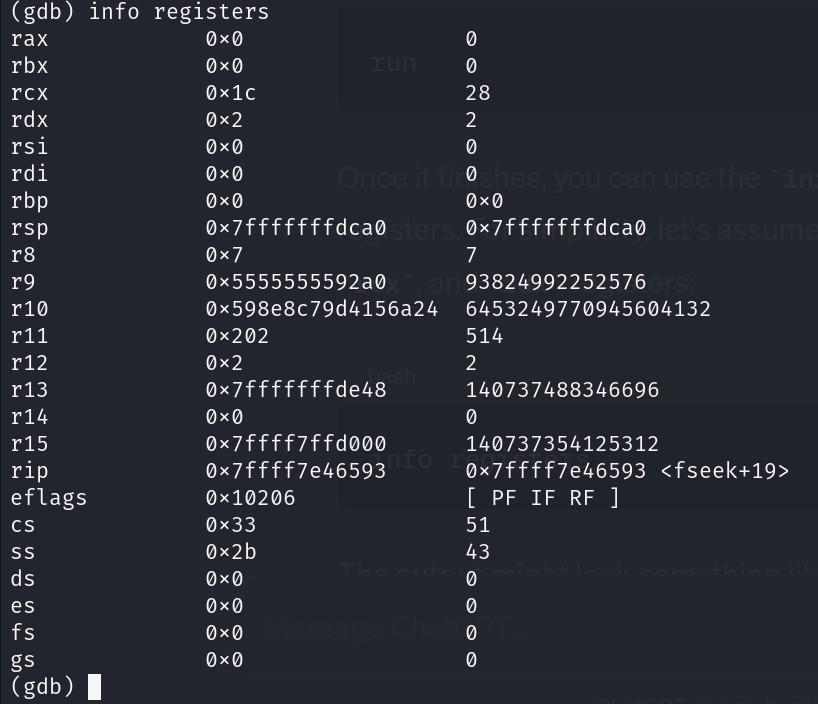
Display the values of all registers:
info registers
View Source Code:
Use list to show the source code around the current line:
listQuit gdb:
To exit gdb, type:
quit
Comments
Post a Comment